WIP
What you simulate
WIP simulates how work items flow through a process while tracking the amount of of work currently in progress at any given time.
The setup chain
The setup consists of a number of components that need to be configured. Each object depends on
the one before it: Begin at Plant and end at Scenario.
Plant | Top node. Sets Operator Speed and Operator Diameter. |
Asset Group | Hierarchical node under the Plant — Area, Line, …. |
Asset Model | Reusable workstation template (optional). |
Asset | An individual workstation. |
Feeding Asset | An external rack outside a workstation. |
Layout | Physical arrangement of Assets — version-controlled. |
Flow | Production sequence connecting |
Scenario | A Line Balancing or WIP run. |
Reuse existing structure to the largest possible extent.
AI assistance
There is the possibility to get deeper insight on all pages where there is an AI icon. The AI is not only
doing calculations and simulations, it is also context-aware and can answer questions about the page you are on, the line you are configuring, and the documents attached to the Plant or Asset Group.

Run a WIP scenario
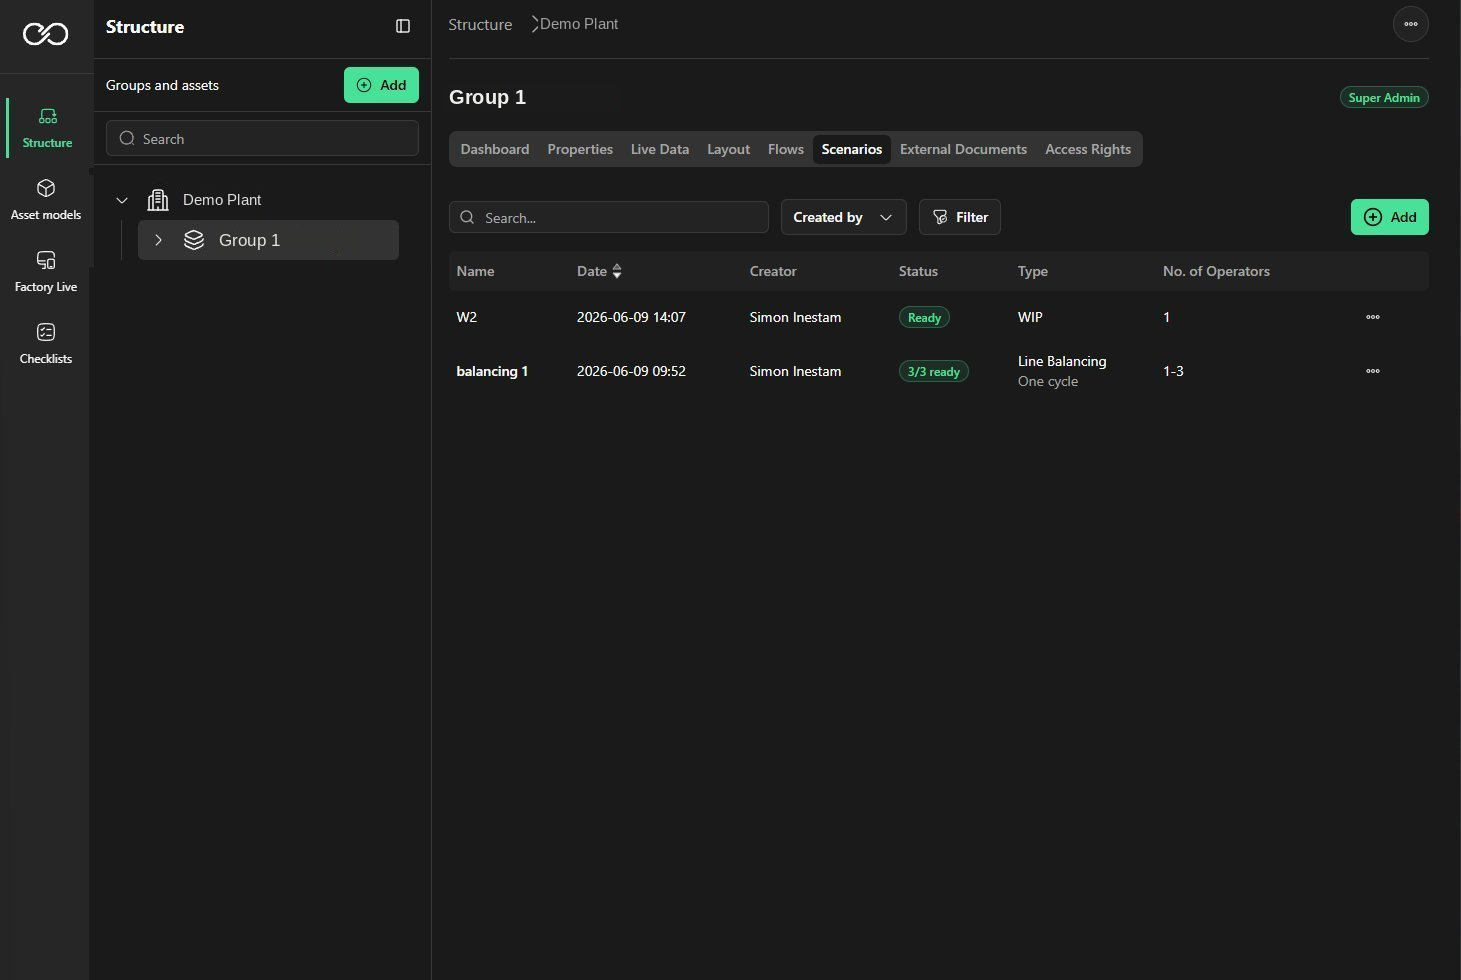
Add a new scenario from the line’s Asset Group, configure it with the activated Layout and Flow versions, and launch the calculation.
- From the Asset Group’s Scenarios tab, select Add, then WIP.
- Set the Name of the scenario.
- Select the Layout — the layout must be activated to be selectable.
- Select the Flow — the flow must be activated to be selectable.
- Set Customer demand per day (optional — used to estimate the number of operators).
- Set Product group and Product family (optional).
- Choose the WIP Mode — Open or Closed (see below).
- Enter the final value: in Open mode set the Arrival Rate (units/h); in Closed mode set the WIP Capacity (units).
- Select Generate.
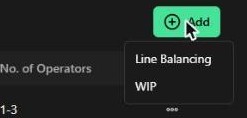
Selecting Add offers two scenario types: Line Balancing and WIP.
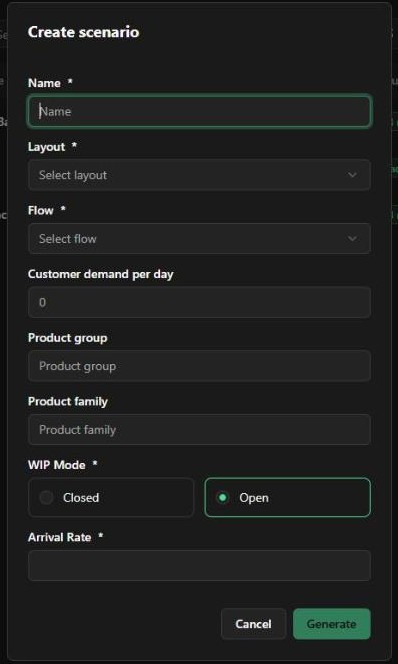
Create scenario in Open mode — the final required field is Arrival Rate (units/h).
Open vs. Closed WIP

Open - items arrive at a set Arrival Rate. WIP is free to grow or shrink depending on how the line keeps up.
Closed - a fixed WIP Capacity of items circulates in the process; new work enters only as finished work leaves.
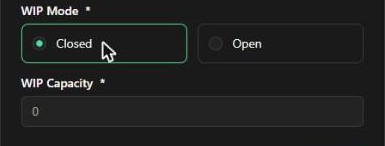
Switching to Closed mode replaces Arrival Rate with the WIP Capacity field (units).
Calculation time
A standard calculation takes between 1 and 5 minutes depending on the complexity of the line.
Result — Analyse
The Analyse tab shows the Total WIP chart across the calculated period, alongside the input parameters and the results in numbers. Below the chart, the Products bar splits items into Processing vs. Waiting, and the State Distribution shows per-asset Running / Waiting / Stopped time.
- Items produced — total units completed in the run.
- Efficiency — how effectively the line converted capacity into output.
- Capacity Throughput — the line’s theoretical maximum output (units/h).
- Realized Throughput — the actual output achieved (units/h).
- Takt Time — the pace required to meet demand.
- Cycle time — time per produced unit.
- Critical WIP — the WIP level above which adding more work no longer raises throughput.
- Average WIP — the average amount of work in process during the run.
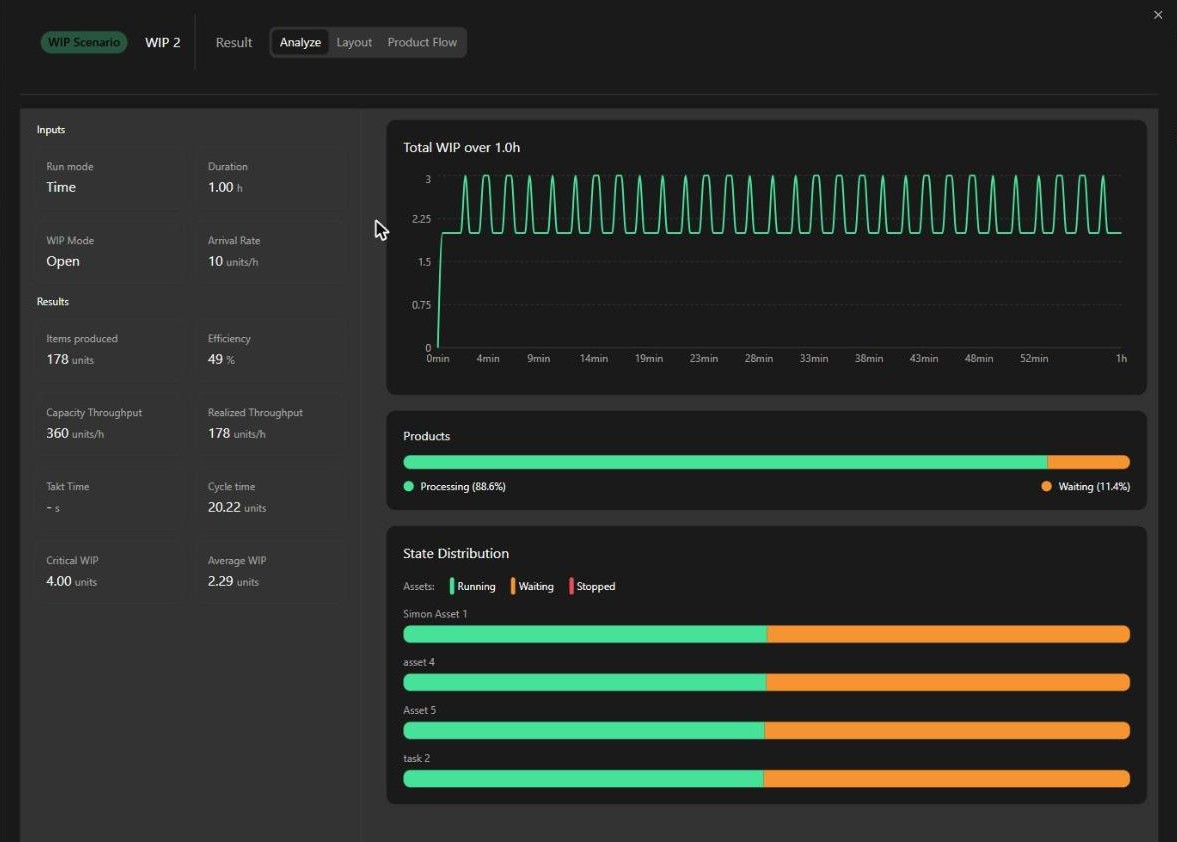
Result › Analyse: the Total WIP chart with input parameters and numeric results on the left, the Products split and per-asset State Distribution below.
Result — Layout
The Layout tab shows the physical arrangement of the machines with their associated Metrics (cycle time, time per unit, critical WIP, produced items per hour, operators, OEE, operational hours, performance variation) and the Tasks list with each station’s cycle time. The main bottleneck is highlighted on the layout so you can see immediately where the process is constrained.
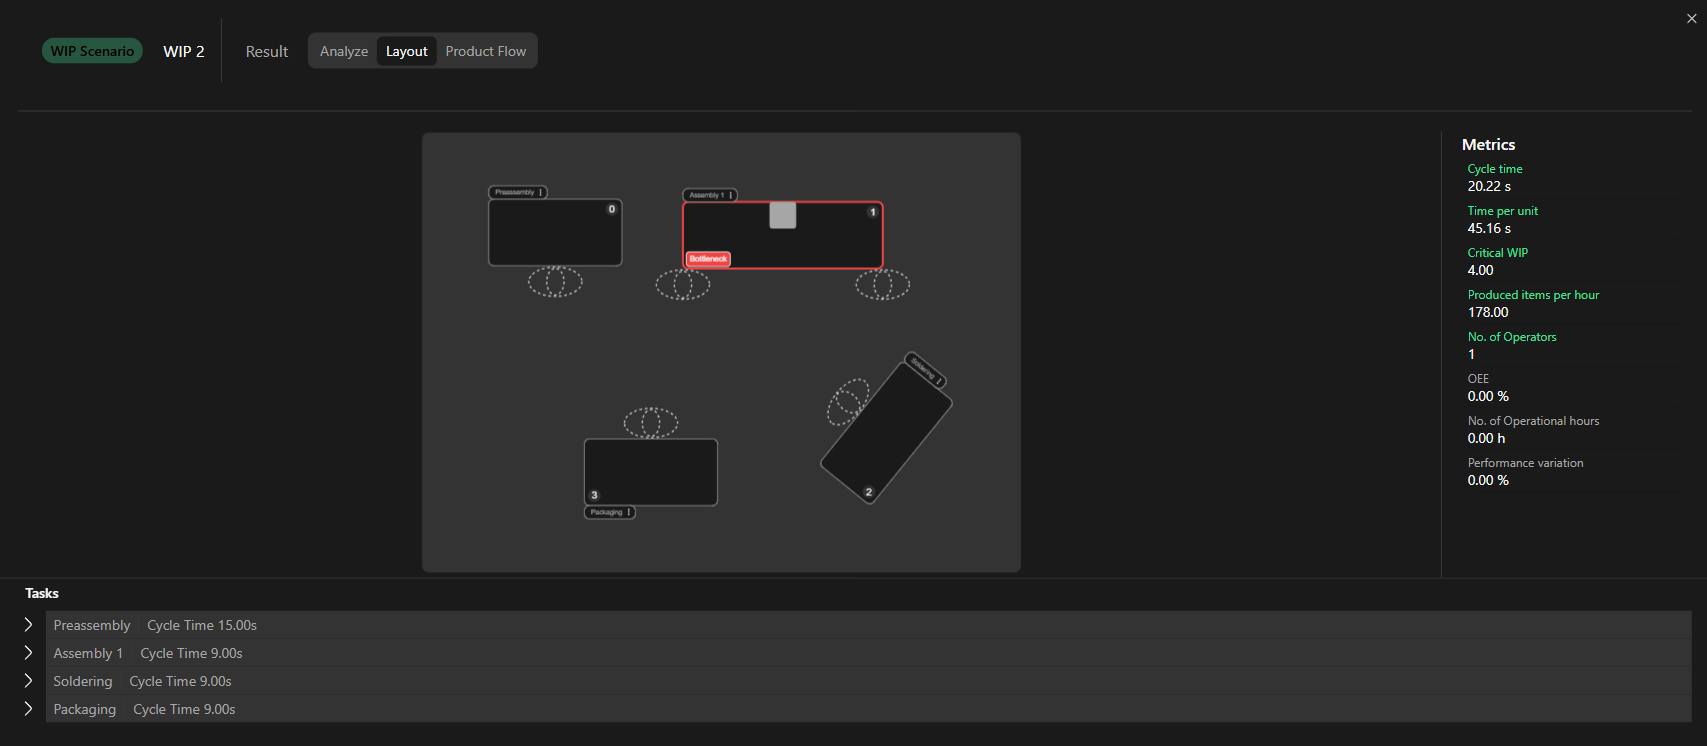
Result › Layout: station layout with the bottleneck flagged in red, the Metrics panel, and the per-station Tasks list.
Result — Product Flow
The Product Flow tab plays back the calculation over time, showing the product moving through each step of the process from Source to Sink. Use the playback controls to step through or speed up the run; the live Current status panel shows Output and Total WIP, and each node reports its state (e.g. Starved). The bottleneck node is flagged in the graph.
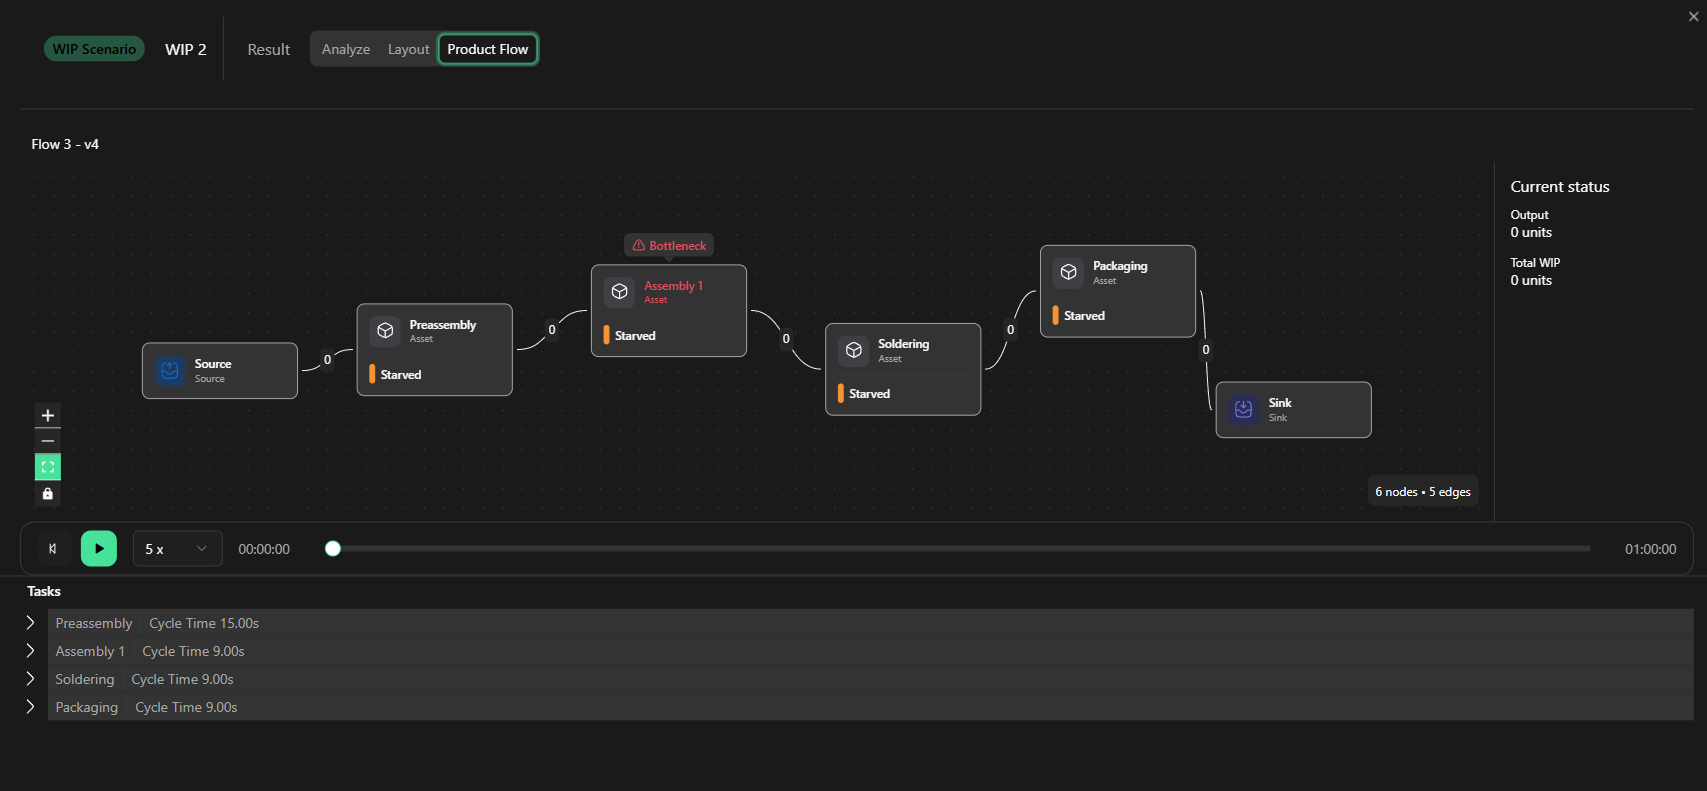
Result › Product Flow: the flow graph from Source to Sink with the bottleneck flagged, playback controls, and the live Current status panel.
The Product Flow and the full WIP calculation can also be viewed from a digital-twin perspective, letting you place the result against a real-world visualization.
Was this article helpful?
That’s Great!
Thank you for your feedback
Sorry! We couldn't be helpful
Thank you for your feedback
Feedback sent
We appreciate your effort and will try to fix the article