Line Balancing
What you simulate
Line Balancing lets you simulate a production line in the EpiczLab platform — its stations, the tasks performed at each station, the operators who work them, and the flow of material between them. This guide covers the setup chain, creating a Line Balancing scenario, and reading the results.
The setup chain
The setup consists of a number of components that need to be configured. Each object depends on
the one before it: Begin at Plant and end at Scenario.
Plant | Top node. Sets Operator Speed and Operator Diameter. |
Asset Group | Hierarchical node under the Plant — Area, Line, …. |
Asset Model | Reusable workstation template (optional). |
Asset | An individual workstation. |
Feeding Asset | An external rack outside a workstation. |
Layout | Physical arrangement of Assets — version-controlled. |
Flow | Production sequence connecting |
Scenario | A Line Balancing or WIP run. |
Reuse existing structure to the largest possible extent.
AI assistance
There is the possibility to get deeper insight on all pages where there is an AI icon. The AI is not only
doing calculations and simulations, it is also context-aware and can answer questions about the page you are on, the line you are configuring, and the documents attached to the Plant or Asset Group.

The AI assistant icon
Open the Scenarios tab
Open the asset group and select the Scenarios tab. Any existing scenarios are listed here.
- Search / Created by / Filter. Find or filter the listed scenarios.
- Columns. Name, Date, Creator, Status, Type, and No. of Operators.
- Add. Choose Line Balancing to create a scenario.
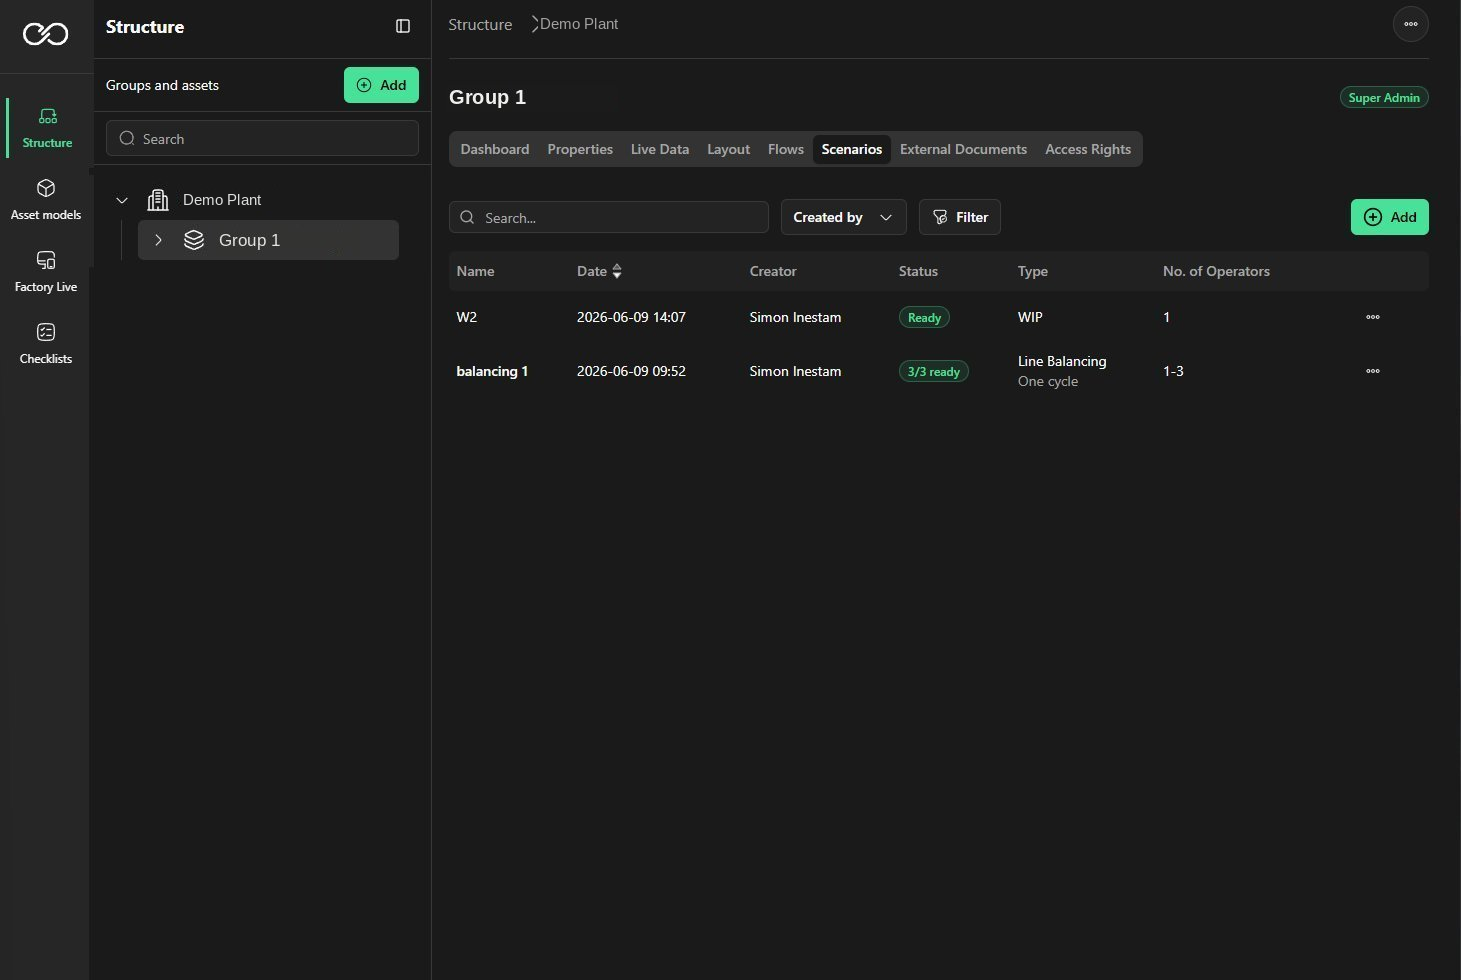
The Scenarios tab listing existing scenarios with their status, type and operator count.
Line Balancing
Open the line’s asset group, go to Scenarios, select Add → Line Balancing, then configure the scenario and select Generate.
Fields
- Name. A name for the scenario.
- Layout. The layout to use. It must be activated to be selectable.
- Flow. The flow to use. It must be activated to be selectable — pair the correct layout with the correct flow.
- Customer demand per day. How many units need to be produced per day (used to estimate the number of operators).
- Product group. Optional.
- Product family. Optional.
- Type. How tasks fit into cycles:
- One cycle balancing. The default.
- Multi cycle balancing. Set whether to run a Multi Cycle calculation (Operators can share assets over multiple cycles).
- Number of operators. The number of operators to balance for.
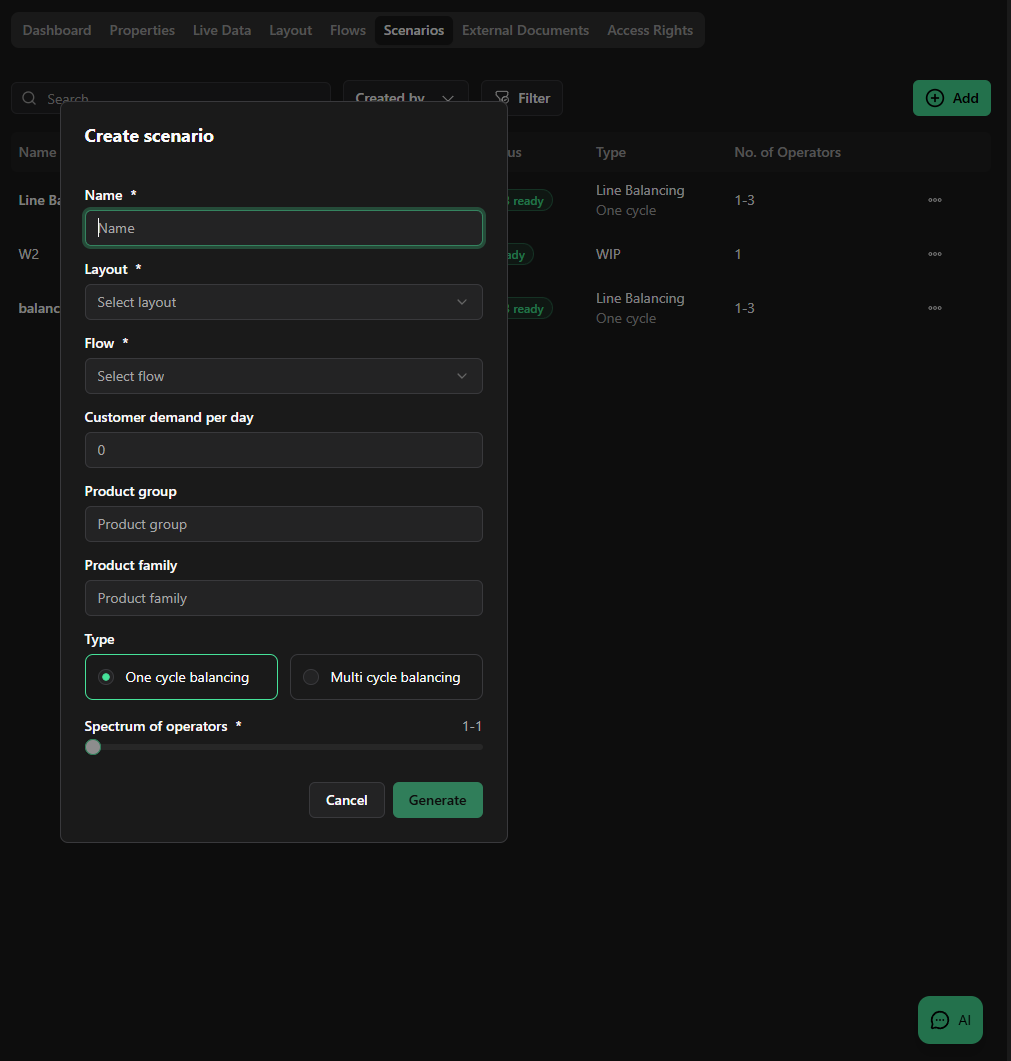
The Create scenario dialog for Line Balancing.
Running time
A Line Balancing calculation takes between 5 and 90 minutes depending on the complexity of the line; Multi cycle takes 2–3× a standard calculation, so plan for 10–270 minutes. The scenario list shows a status (for example Ready or 3/3 ready) so you can track progress.
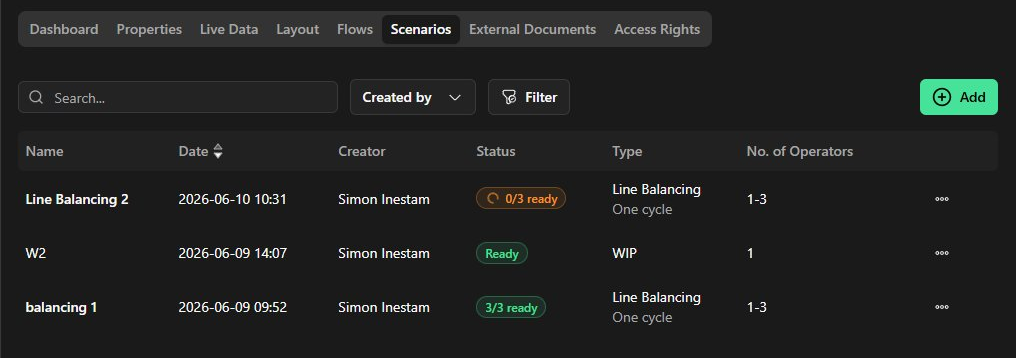
A scenario calculating, with its status indicator.
Line Balancing Results
Choose the operator count
The top bar shows the scenario name and the operator-count options (e.g. 1, 2, 3, 4) next to Analyze.
- Analyze (overview). With no specific count selected, compares the operator counts side by side (the TPU chart).
- Pick a number. Opens that result in full. A count may be missing if no valid solution was found for it.
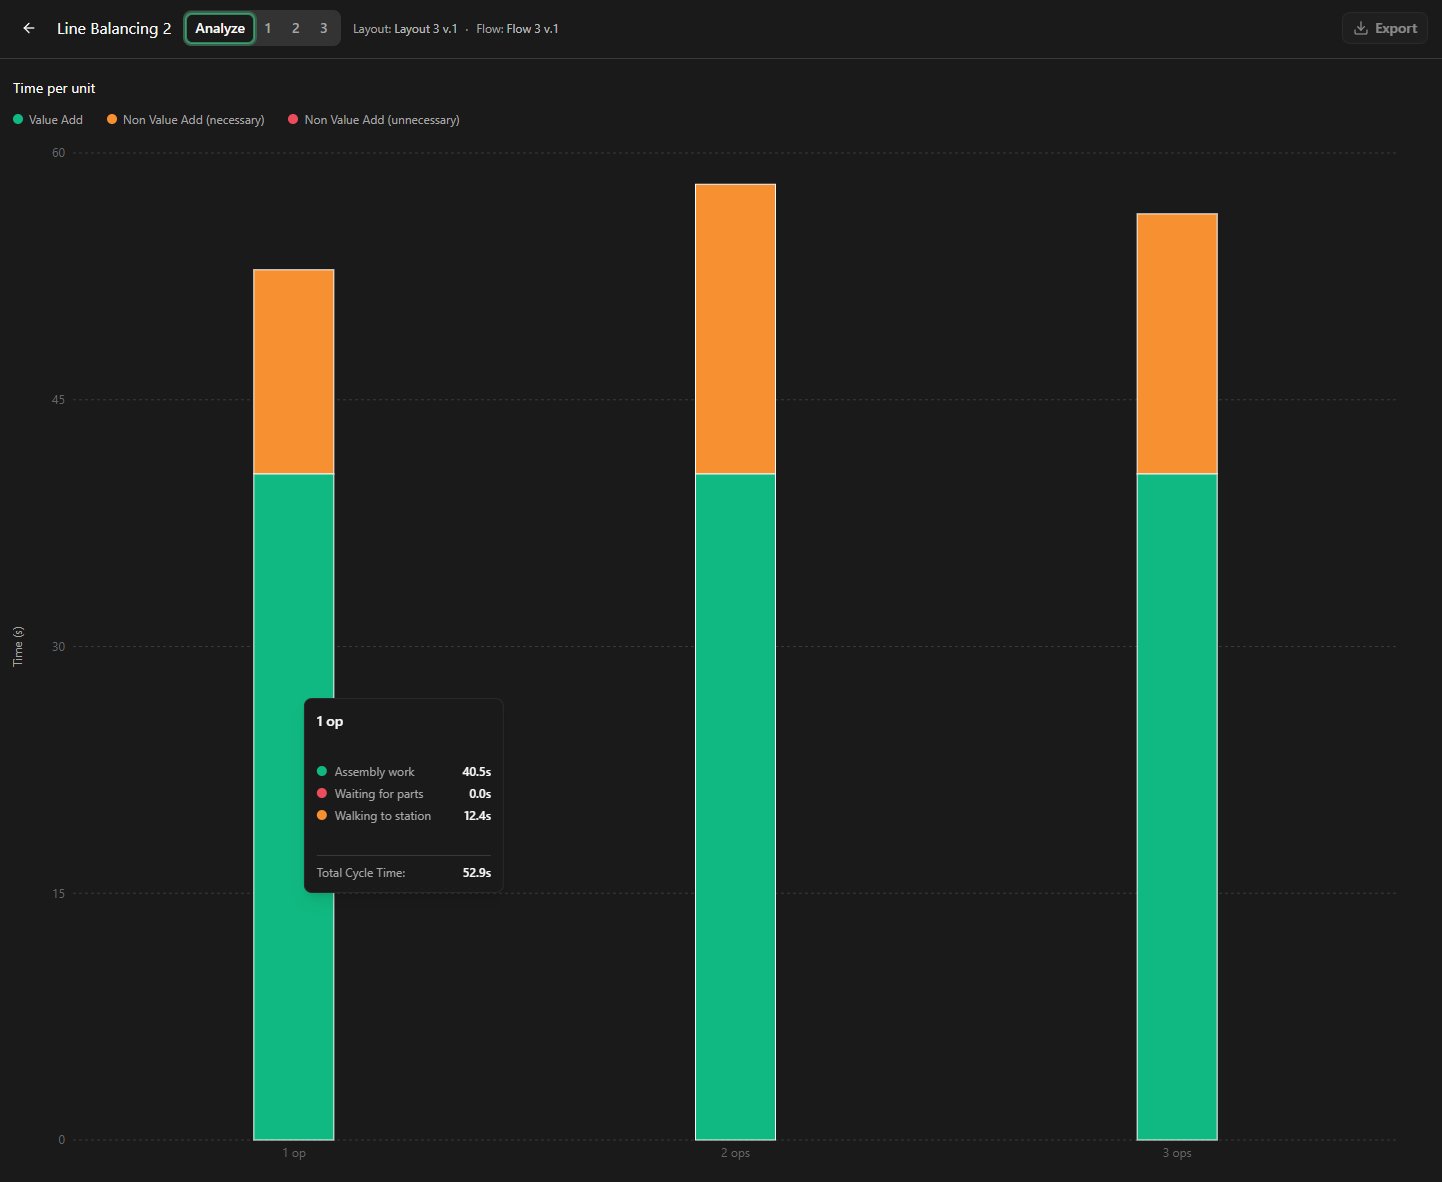
The Analyze overview with the TPU chart across operator counts.
Selecting a specific operator count shows the layout of the line and the path each operator will travel, with operator load shown alongside.
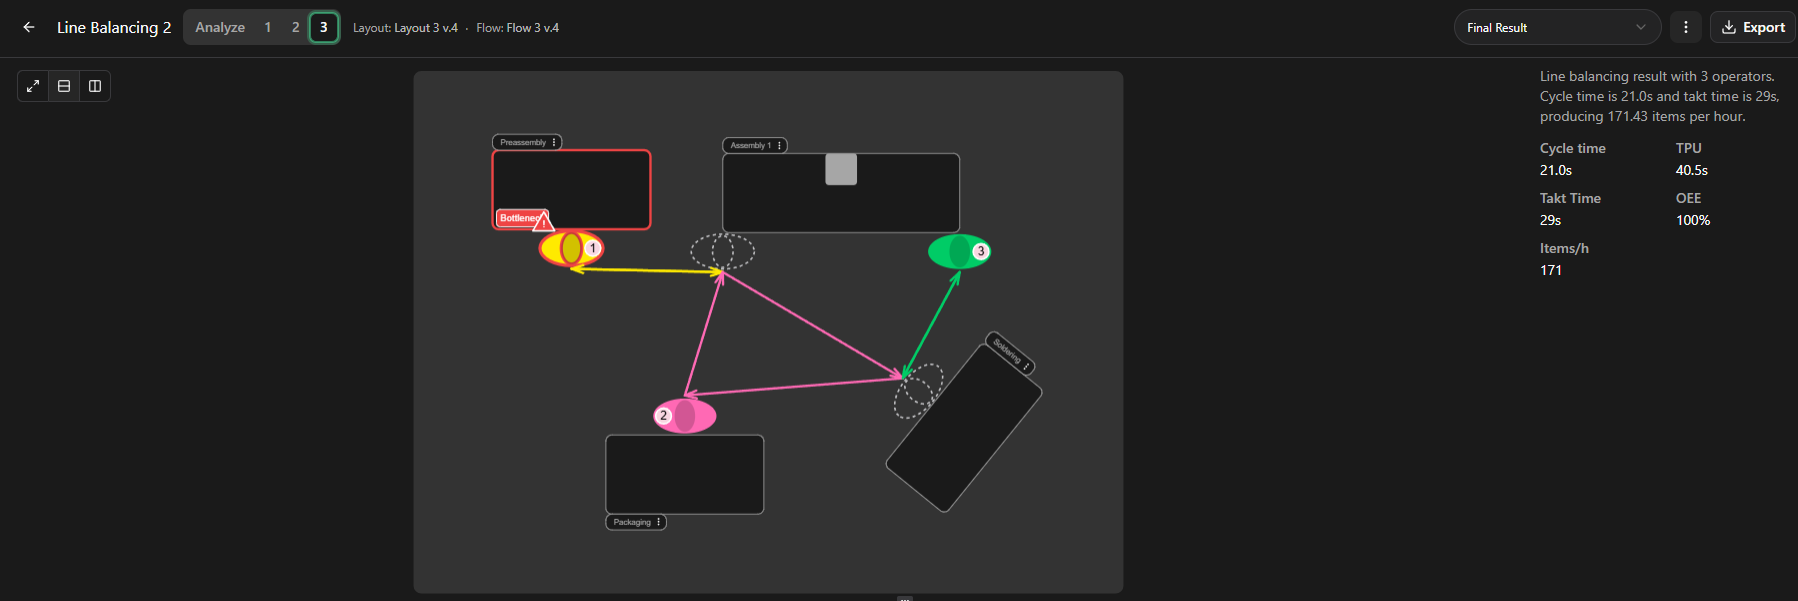
Layout with operator paths for a selected operator count.
Operator views (bottom panel)
- Operator Load. A stacked bar per operator showing total time split by category, against the CT (cycle time) and TT (takt time) reference lines. Each bar is split into Man (Necessary), Necessary Waste, and Unnecessary Waste. Hover a bar to list that operator’s tasks with their durations and the total cycle time.
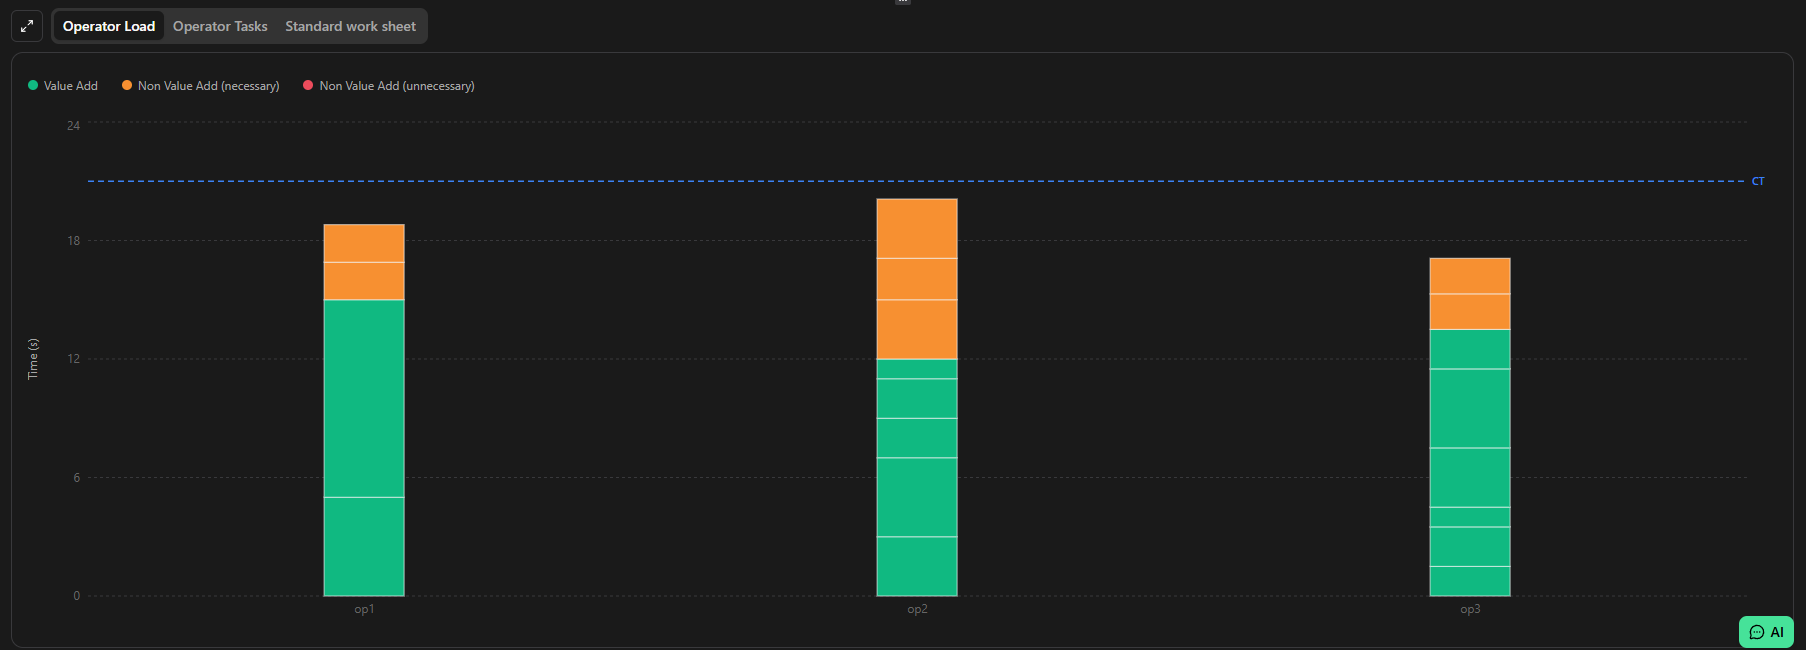
Operator Load — per-operator load bars against CT and TT.
- Operator Tasks. A per-operator timeline listing each task in order: task name, asset, type (Man or Walk), duration, and a 2nd marker for tasks that run only every second cycle. You can filter to a single operator or show all.
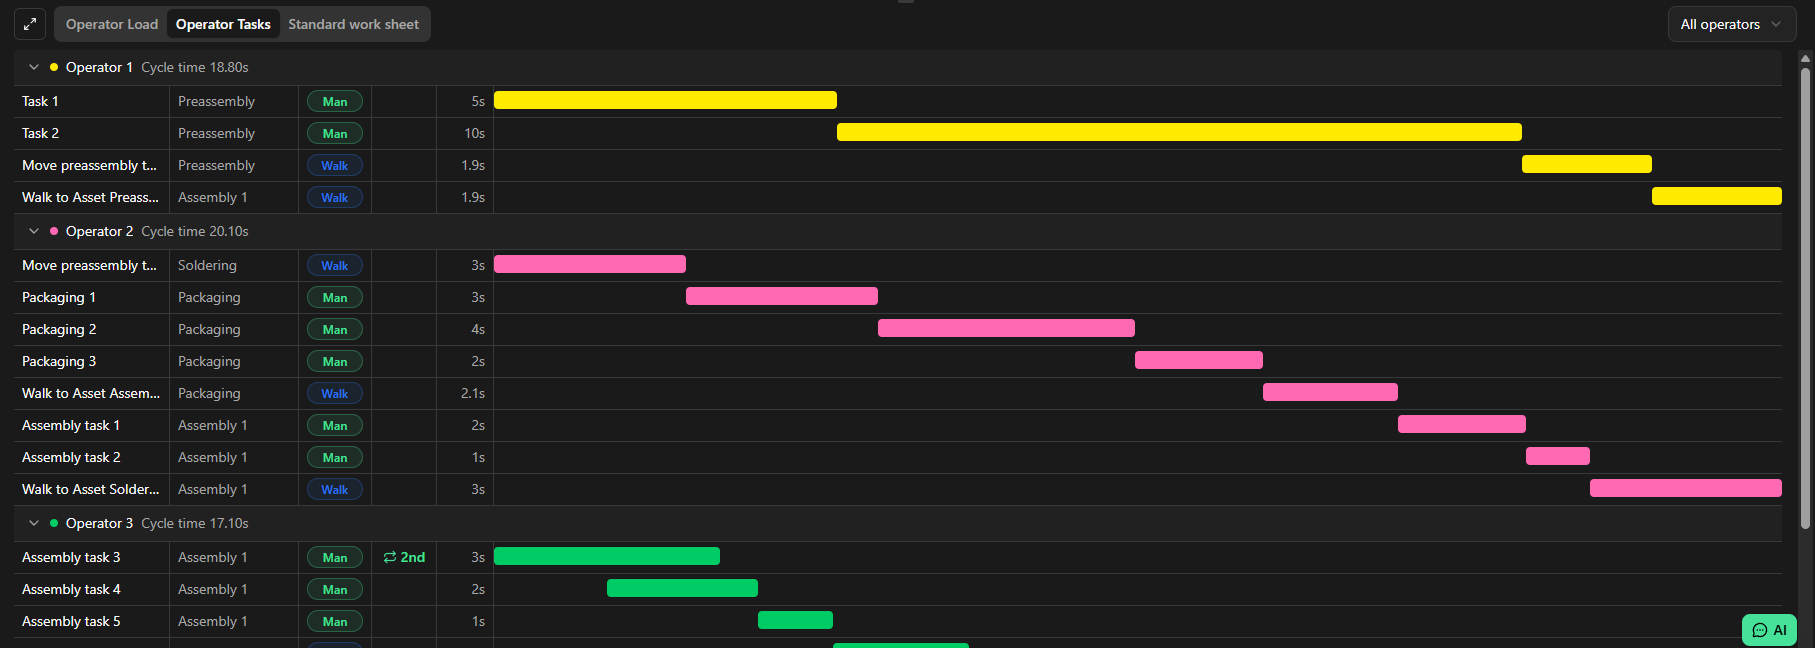
Operator Tasks — the per-operator task list.
- Standard work sheet. A standard work chart laid out across Cycles. The dotted lines trace the operator walking between tasks. Assets that run at the same time are marked Parallel. The number of cycles displayed depends on the combination of alternatives in the model — for example, tasks marked as repeated.
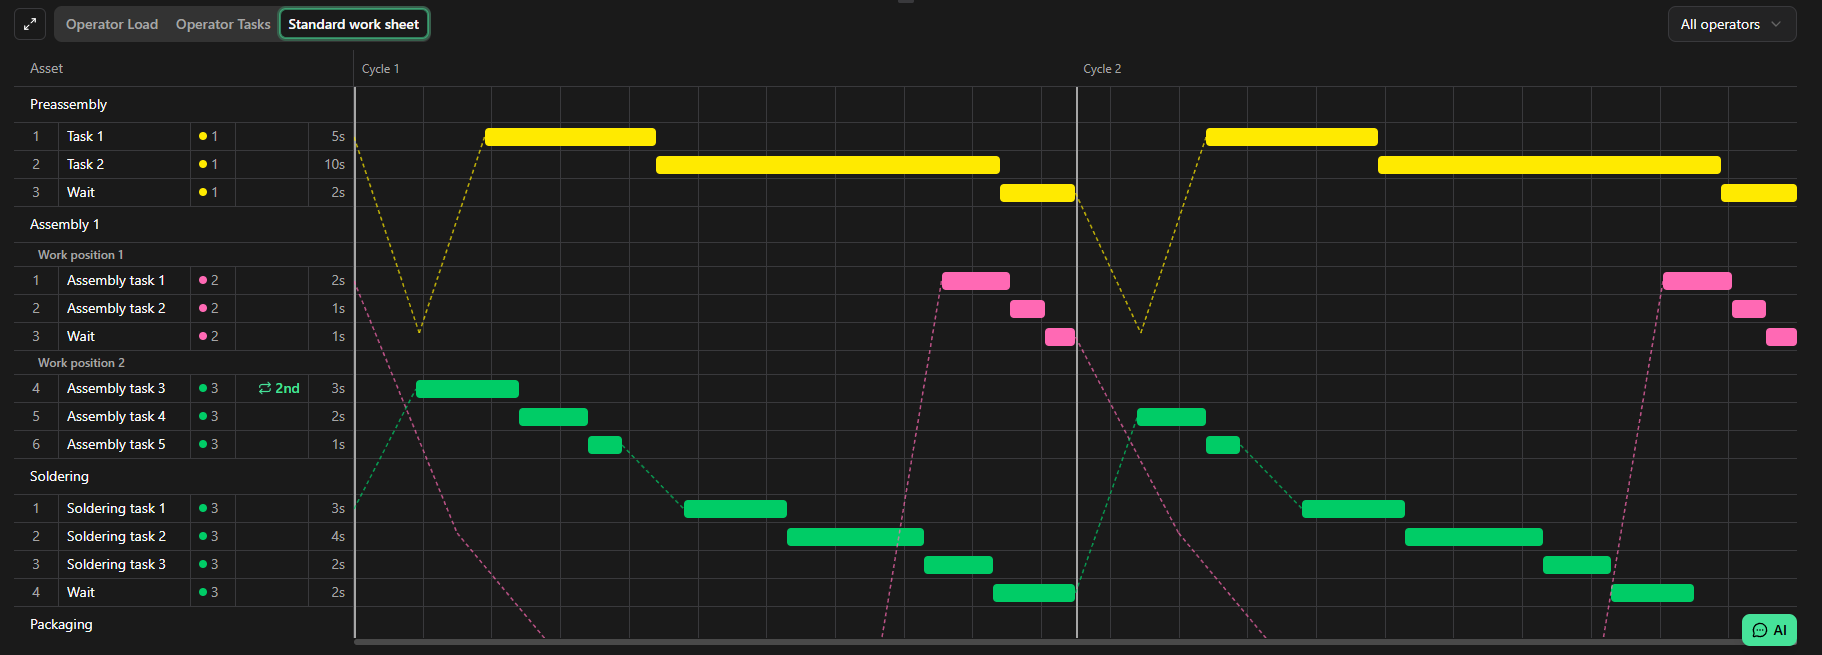
The Standard work sheet across cycles.
Export
Click Export (top right) to export the result to Excel and share it. You can export with all operators combined on one sheet, or with one specific operator per sheet.
Coming soon: Line Balancing in 3D
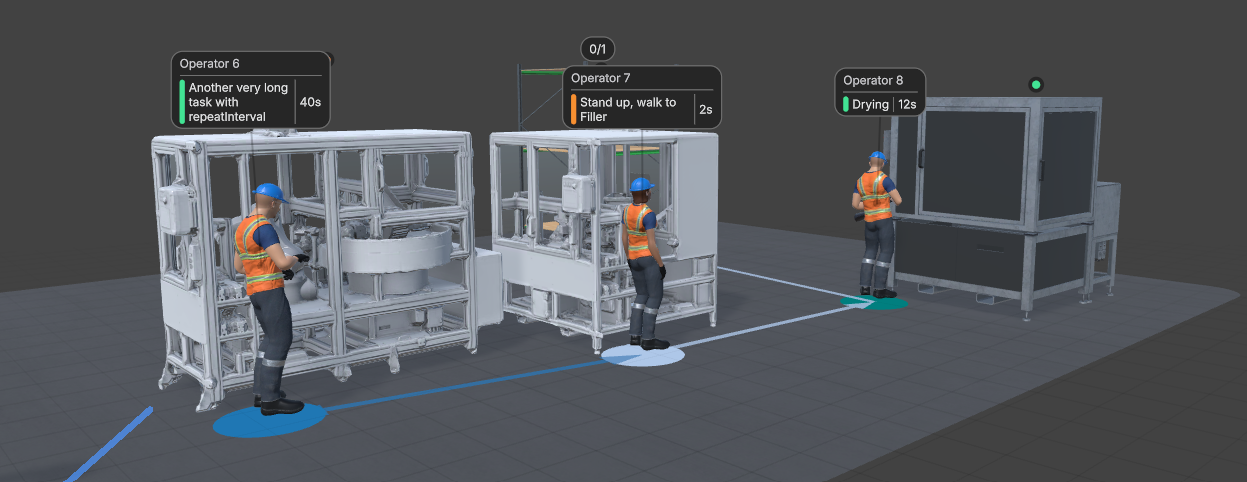
It will be possible to see the result of a Line Balancing run in 3D. This is done through Factory Live — a separate EpiczLab application. You open Factory Live and load the Line Balancing result there to visualise the line, the operator paths, and the loads in three dimensions.
Was this article helpful?
That’s Great!
Thank you for your feedback
Sorry! We couldn't be helpful
Thank you for your feedback
Feedback sent
We appreciate your effort and will try to fix the article